
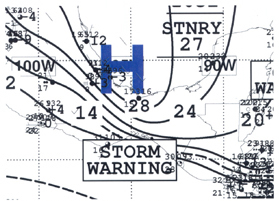
A single GRIB picture for 3/3/2013 tells the story - AVOID the Gulf of Tehuantepec Mexico!

High Seas Forecast NWS National Hurricane Center Miami FL 1630 UTC Sat Mar 02 2013
Superseded by next issuance in 6 hours
Seas given as significant wave height...which is the average height of the highest 1/3 of the waves. Individual waves may be more than twice the significant wave height.
Securite
E Pacific from the Equator to 30n E of 140w.
Synopsis valid 1200 UTC Sat Mar 02. 24 hour forecast valid 1200 UTC sun Mar 03. 48 hour forecast valid 1200 UTC Mon Mar 04.
.Warnings.
...Storm Warning... .Within 60 nm either side of line from 16n94.5w to 13n96w... including the Gulf of Tehuantepec...N to NE winds 30 to 45 kt. Seas 13 to 19 ft. .06 hour forecast within 60 nm either side of line from 16n94.5w to 13n96w...including the Gulf of Tehuantepec...N to NE winds 40 to 55 kt. Seas 15 to 22 ft. Elsewhere within 90 nm either side of line from 16n94.5w to 13n96w to 11.5n97w N to NE winds 30 to 40 kt. Seas 12 to 18 ft. .24 hour forecast within 75 nm either side of line from 16n94.5w to 13n96.5w...including the Gulf of Tehuantepec...N to NE winds 40 to 50 kt. Seas 16 to 24 ft. Elsewhere within 120 nm either side of line from 16n94.5w to 11n97.5w N to NE winds 30 to 40 kt. Seas 16 to 20 ft. .30 hour forecast within 90 nm either side of line from 16n94.5w to 13n97w...including the Gulf of Tehuantepec...N to NE winds 30 to 45 kt. Seas 14 to 21 ft. .48 hour forecast conditions below gale force.
...Gale Warning... .48 hour forecast within 45 nm of line 11n86w to 09.5n90w... including the Gulf of papagayo...NE winds 30 to 35 kt. Seas 8 to 13 ft.
...Synopsis and forecast.
.except as noted in warnings...within 90 nm either side of line from 16n94.5w to 13n96w to 11n98w N to NE winds 20 to 30 kt. Seas 11 to 16 ft. Elsewhere from 09n to 14n between 92w and 101w winds 20 kt or less. Seas 8 to 12 ft primarily in N swell. .06 hour forecast...Except as noted in warnings...within 150 nm either side of line from 16n94.5w to 13n96w to 10.5n98w N to NE winds 20 to 30 kt. Seas 10 to 15 ft. Elsewhere from 08n to 14n between 92w and 102w winds 20 kt or less. Seas 8 to 12 ft primarily in N swell. .24 hour forecast...Except as noted in warnings...within 180 nm either side of line from 16n94.5w to 13n96.5w to 09n98.5w N to NE winds 20 to 30 kt. Seas 14 to 18 ft. Elsewhere from 04n to 14n between 92w and 106w winds 20 kt or less. Seas 8 to 13 ft primarily in N swell. .30 hour forecast...Except as noted in warnings...within 150 nm either side of line from 16n94.5w to 13n97w to 09n99.5w N to NE winds 20 to 30 kt. Seas 13 to 18 ft. Elsewhere from 03n to 14n between 92w and 108w winds 20 kt or less. Seas 8 to 14 ft primarily in N swell. .48 hour forecast within 120 nm either side of line from 16n94.5w to 13n96.5w N to NE winds 20 to 25 kt. Seas 9 to 11 ft. Elsewhere S of 15n between 92w and 115w winds 20 kt or less. Seas 8 to 13 ft primarily in N swell.
.Trough from 27n137w to 23n140w. W of trough NE winds 20 to 25 kt. Seas 11 to 13 ft with NW swell. Elsewhere area bounded by 30n124w to 20n112w to 05n140w to 30n140w to 30n124w winds 20 kt or less. Seas 8 to 11 ft primarily in mixed NE and NW swell with highest seas se of trough. .24 hour forecast trough W of area. Area bounded by 30n116w to 04n127w to 04n140w to 30n140w to 30n116w winds 20 kt or less. Seas to 10 ft primarily in mixed NE and NW swell. .48 hour forecast area bounded by 30n116w to 05n122w to 04n140w to 20n140w to 30n125w to 30n116w winds 20 kt or less. Seas to 10 ft primarily in mixed NE and NW swell.
.18 hour forecast N of 08n between 85w and 90w...Including the gulfs of fonseca and papagayo...NE winds 20 to 30 kt. Seas to 9 ft. Elsewhere from 07n to 12n between 90w and 92w winds 20 kt or less. Seas 8 ft in mixed N and SW swell. .24 hour forecast within 90 nm either side of line from 11n86w to 07n91w...including the Gulf of papagayo...NE winds 20 to 30 kt. Seas 9 to 12 ft. Elsewhere N of line from 09n85w to 05n92w winds 20 kt or less. Seas to 11 ft primarily in mixed N and SW swell. .48 hour forecast...Except as noted in warnings...area bounded by 11n85w to 02n92w to 11.5n92w to 11n85w NE winds 20 to 30 kt. Seas 8 to 12 ft.
.36 hour forecast N of 05n between 79w and 80w...Including the Gulf of Panama...N to NE winds 20 to 25 kt. Seas to 8 ft. .48 hour forecast within 75 nm of line 09n79w to 04n82w... Including the Gulf of Panama...N to NE winds 20 to 30 kt. Seas to 10 ft S of 07n.
.Remainder of area winds 20 kt or less. Seas less than 8 ft.
Convection valid at 1500 UTC Sat Mar 02... .Trough from 27n137w to 23n140w...Scattered moderate within 90 nm of trough.
.Scattered moderate isolated strong within 75 nm of 15n101.5w.
.Intertropical convergence zone/monsoon trough... Monsoon trough axis from 07n77w to 06n90w to 03n98w to 04n106w. ITCZ axis from 04n106w to 04n140w. Scattered moderate isolated strong within 150 nm line 09n83w to 04n92w...within 90 nm line 06n98w to 10n102w...within 15 nm of line 04n108w to 05n123w...and 15 nm of line 03n129w to 07n136w.
$$ .Forecaster Nelson. National Hurricane Center.
More details about this frequent event:
Gulf of Tehuantepec Gales
The recent cold outbreak over the eastern US caused gale to storm force winds over the Gulf of Tehuantepec, an area prone to heavy weather during the cold season. I first heard about the Gulf of Tehuantepec Gales from my father who sailed with the United Fruit Company’s Great White Fleet during the late 1940’s and 1950’s. The Gulf of Tehuantepec gales are strong northerly winds that funnel through gaps in the Sierra Madre Mountains and spill out over the Gulf of Tehuantepec along the south coast of Mexico during the winter season.
The Sierra Madre extend southeastward through Mexico and Central America and separates the Gulf of Mexico, the Bay of Campeche´ and Caribbean Sea from the Pacific Ocean. Several mountain gaps allow air to fow across Mexico and the most prominent gap is the Chievela Pass which allows strong cold air surges to pass into the Gulf of Tehuantepec on average about 15 times each winter season with about 2 of these strong enough to reach storm force conditions.
The winds are produced when there is a strong pressure gradient between the Gulf of Mexico to the north and the eastern North Pacific to the south. Northerly winds can increase to storm or even hurricane force during the more extreme events. The first event of each cool season normally occurs in mid-October with the last event occurring in late March or early April.
At the outset of gale events, surface pressures reach a maximum value of about 1028mb at Brownsville and 1024mb at Coatzacoalcos. During storm events the pressure at Brownsville are about 4mb higher and at Coatzacoalcos about 3mb more. During Tehuantepec events, the track of the high pressure center is often more critical than the maximum pressure at the center. The path that the anticyclone takes drives the northerly fetch down the coast of Mexico and setting up the strong pressure gradient across the Isthmus of Tehuantepec.
As a practical matter, whenever the Brownsville pressure exceeds 1020mb there is a good chance that a Gulf of Tehuantepec event may occur so mariners expecting to pass across the Gulf of Tehuantepec should monitor the surface forecast charts for the Western Gulf of Mexico as an indicator.
During gale events, the center of the high could track as far north as the Tennessee and Ohio River valleys while storm events require the high center to track into Mexico or the western Gulf of Mexico. Storm events are also frequently correlated to strong 500mb upper level troughs.
Since QuickScat’s recent demise, one critical observation tool for monitoring the Gulf of Tehauntepec surface winds has been lost. During the last 10 years, QuckScat data was instrumental in helping meteorologists better understand the dynamics involved with this phenomena and how to forecast both the strength and extent of these outbreaks.
Using the 500mb Chart at sea
One quick and easy method to estimate where the heavy weather will be found is to look at the 500mb chart. On NOAA 500 MB charts issued by the Ocean Prediction Center (OPC), the 5640 m height contour is printed in bold. This is an excellent marker for the southern limit of force 7-8 “westerlies” during the winter season and force 6-7 “westerlies” during the season in the northern hemisphere. In general, the worst weather will be found poleward of this line.

NOAA OPC 500MB Analysis 12Z 26 Feb 2013 - Note 564 line in bold
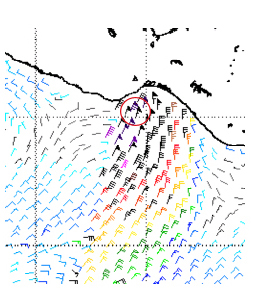
On the 500 mb chart today (above), you can see the 5640 m line (564 on the chart) extending from west to east near 30N latitude over the western North Pacific then extends northeastward across the central North Pacific to near 40-42N latitudes over the eastern North Pacific. If you look at the wind and wave analysis (below) the position of the 564 line in is marked in yellow. As you can see, most of the heavy weather lies to the north.

NOAA OPC North Pacific Significant Wave Analysis 00Z 26 Feb 2013 Note 564 line position is marked in yellow
For more insight see “Mariner’s Guide to the 500 Millibar Chart”
For the professional mariner consider buying Ma-Li Chen and Lee S. Chesneau’s book :Heavy Weather Avoidance and Route Design
No comments:
Post a Comment